top of page

Search

Breakdown on Nifty - Financial Analysis for the week ended 15 Oct, 2024
Nifty has decisively broken below an important support at 23900 last Tuesday, 12th November, 2024, after a 3 week consolidation. This...
1 min read
7
0

Crude closes at the lowest point in 2 months. Price Action for the week ended 15th Nov, 2024
Crude oil closed at USD 66.90 on Friday, November 15 2024, its lowest close since September 10, 2024 when it closed at USD 66.24. In this...
1 min read
3
0

SILVER BREAKS OUT WITH A MEGA MOVE OF 6.4% IN A SINGLE DAY ON FRIDAY!!
Silver has well and truly broken out of a 21 week consolidation pattern that included a 1-2-3 bottom. Please read all about the build up...
1 min read
9
0

US markets gain for the sixth straight week - Financial Analysis for the week ended 18 Oct, 2024
The analysis for the last week ended 11h October mentioned breakouts from bullish patterns for the US indices on the weekly charts that...
2 min read
10
0

Trade Diary - Strong Bullish Trend after breakout on Natural Gas - Fresh Buy Signal on 20th Sep, 2024
Natural Gas has continued to move up after a breakout from a smaller 1-2-3 bottom in the week ended 6th September, 2024. Refer chart...
1 min read
5
0

The Big Breakout - Financial Analysis for the week ended 20 Sep, 2024
The DJIA has broken out of a reverse Head & Shoulder pattern on the weekly chart last week coinciding with the generous 50 bps cut...
2 min read
11
0

Trade Diary - Big Breakdown trades in Copper, Zinc, Silver and Crude in Week ended 19th Jul, 2024
Last week saw some big breakdowns after forming a sideways range or a bearish pattern on the daily chart, in commodities like Copper,...
1 min read
21
0

Trade Selection on Nifty : Chart Pattern
In this post, we delve into the second short-term variable that feeds into our Trade Selection Tool—Chart Patterns on the 1-hour (1H)...
2 min read
14
0

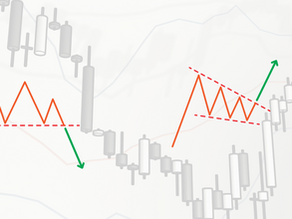
Chart Pattern - Sideways Rectangle or Trading Range
A Sideways Rectangle, also known as a Trading Range or consolidation pattern, represents a period when the price moves within a range,...
2 min read
42
0

Chart Pattern - Flag or Pennant
A Flag or a Pennant forms during sideways consolidation, a continuation pattern that typically occurs after a strong price movement,...
1 min read
26
0

Chart Pattern - W Pattern
The W pattern resembles the letter "W" and is considered a bullish reversal pattern. It typically occurs after a prolonged downtrend and...
1 min read
33
0

Chart Pattern - 1-2-3 Top or 1-2-3 Bottom
A 1-2-3 Top occurs frequently on the charts, sometimes as part of a larger pattern, usually after a significant uptrend. It indicates ...
1 min read
46
0

Chart Pattern - Double Top or Double Bottom
A Double Top is a common chart pattern that indicates a potential trend reversal from bullish to bearish. It occurs after an uptrend and...
2 min read
33
0

Chart Pattern - Head & Shoulders or Reverse Head and Shoulders
The Head & Shoulders (H&S) pattern is a popular and widely recognized chart pattern used in technical analysis to identify potential...
2 min read
39
0

What is required of you to trade our System - the Prerequisites
Now that you understand what our Trading System entails, let’s explore what is required of you to effectively practice it: Basic Charting...
2 min read
52
0

Chart Patterns that you need to know to Trade our System
Hope you have gotten a good grip of the candlestick patterns from the prior post. The next technical tool that you need to know is Chart...
1 min read
45
0
bottom of page